
Because of my lack of satisfaction when I see programmable LED ART Projects, I was thinking a bit more about the colors used in any of the projects – my assumption and based on my experience on my own projects.
In my previous project about the „imperial temple of the light bugs“ I used the color model – HSV (Hue, Saturation, Value) color model. For the colors‘ determination, I used hue, while saturation and value was more given by circumstances within my model. The hue values pairs were the characteristics of each light bug individual. So I diced, using random(), these.
Now if you use random on hue you get a bias to some colors as it prefers for example blue or red over orange and green.
Even more, the models are also overusing high saturated colors instead of lower saturated colors and so on.
So if you want your worked to become colorful in the sense of the colors of butterflies, you need to invest more time and energy into the color model.
I digged a bit deeper, asking deepseek and chatgbt about color models just to find out that there is already a perceptive color model which can be used (or might be good enough)
CIELAB. The idea behind this model is that it introduces a metric which gives you the physiological distance between colors as a number. This metric tells you if you can differentiate the colors at all with a number <2 or if these are very away from each other > 10.
Also there are borders of perception integrated into this model which tells you if your perception stops at all even that the colors might be different as this is the horizon of your color impressions at all.
If you try to find then all colors in this model which are just about 2 away from each other you might get your physiological color map you might want and need to show all colors you can see.
This is the granular element.
On top of this you can then calculate the perceptive complement, split complement, triad, tetradic harmonies, the nearest neighbor and so on.
The first step into this I have done now using JavaScript as the language as my IDE for programming can handle this very well (PYCHARM) and with p5.js there is a very well setup library for the 3d presentation and integration into a webpage.
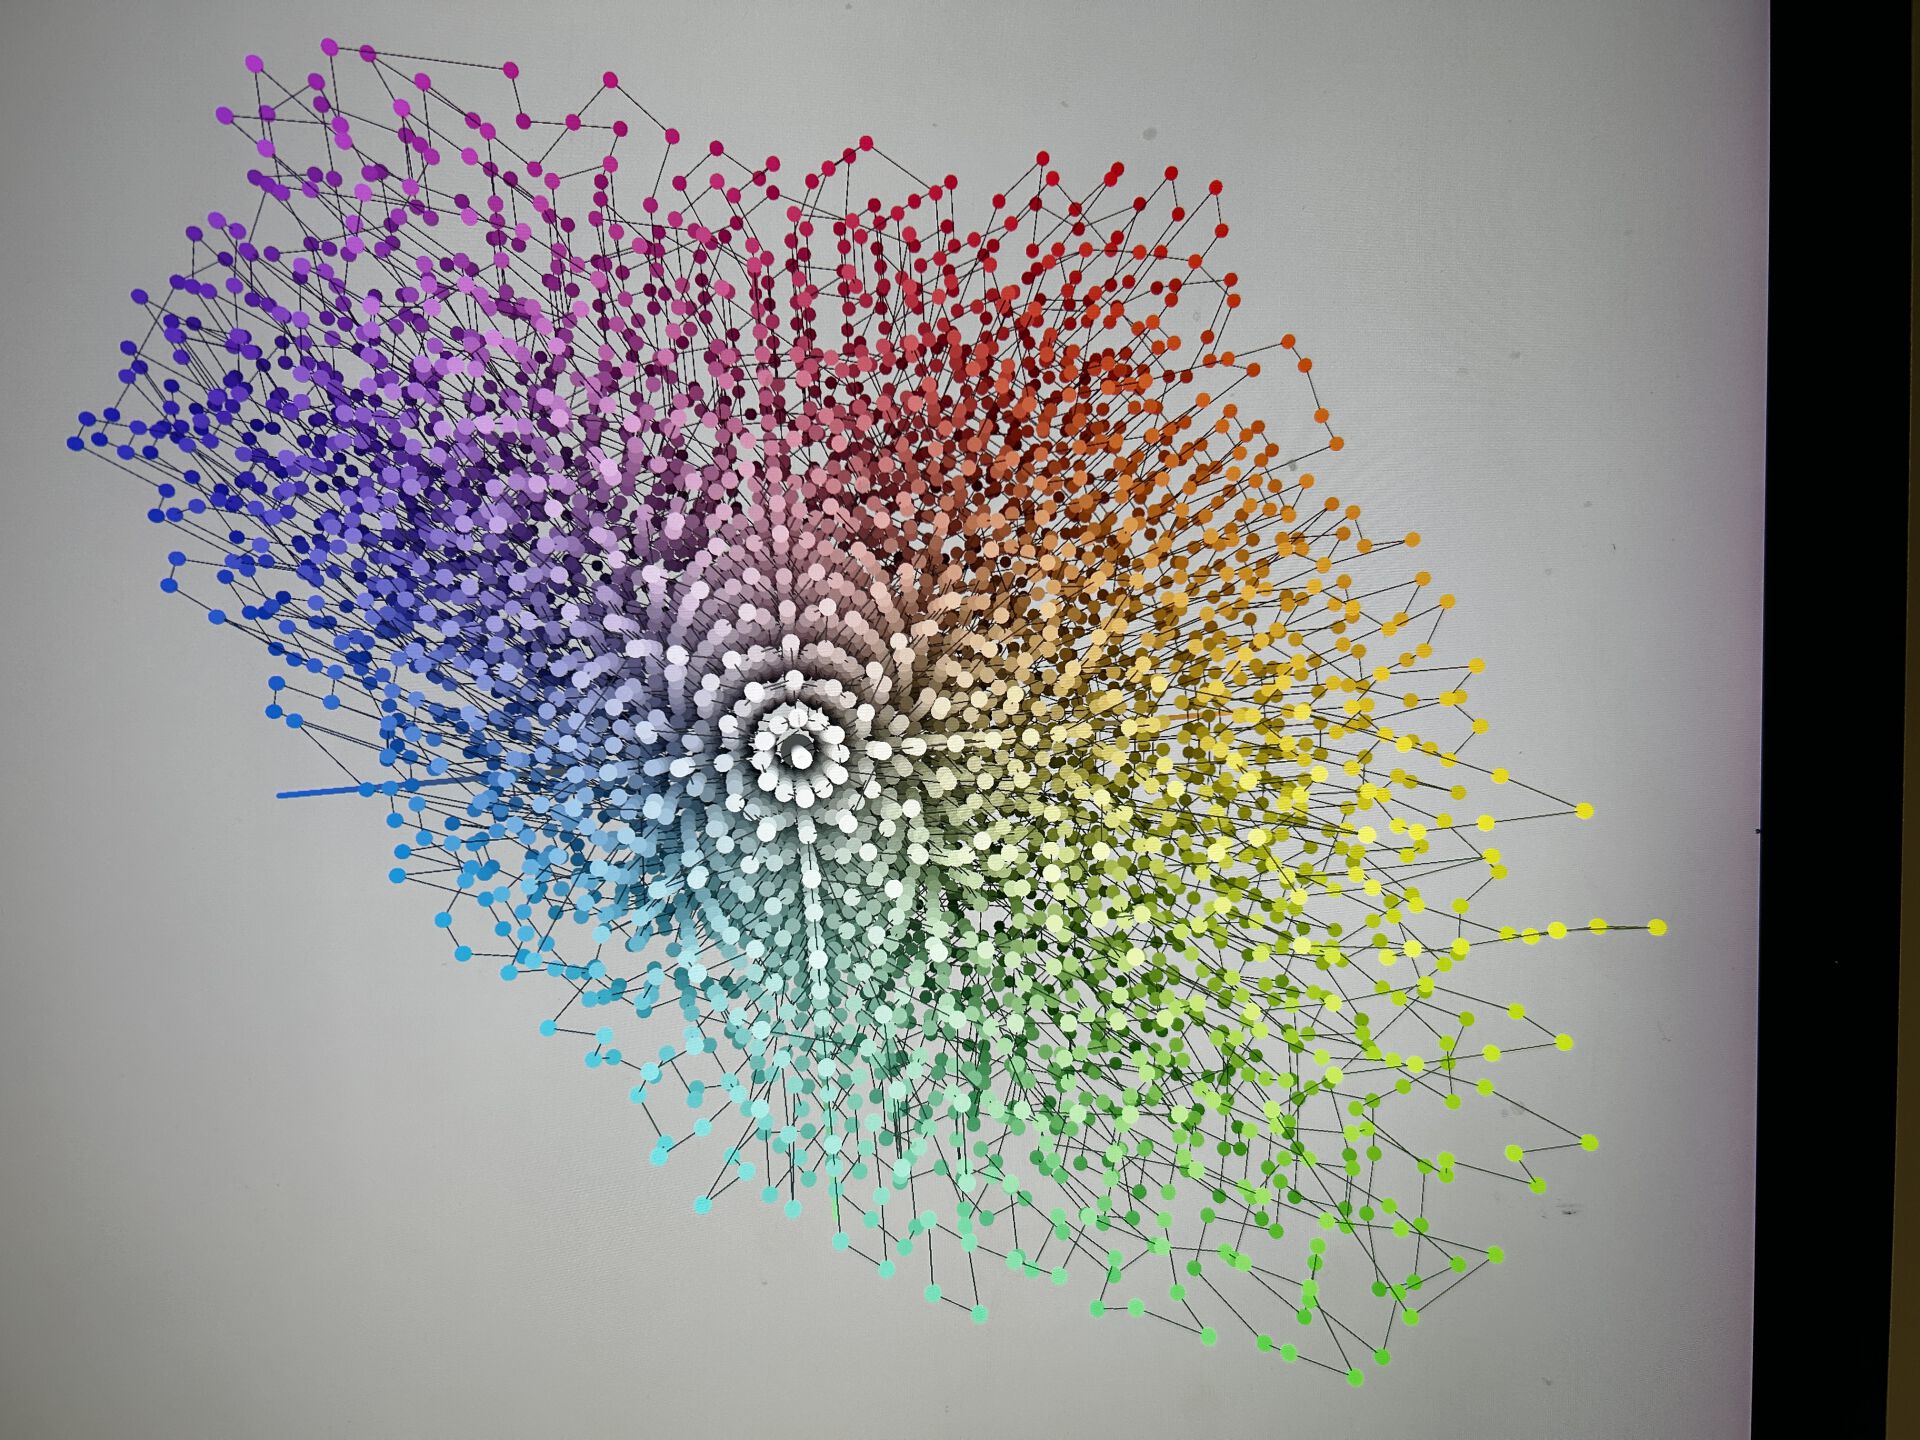
Finally I am currently happy with my results of having about 5000 colorpoints in the Lightness (L star), Green/Red Dimension (A star) and Blue / Yellow Dimension (b star).
I am using the polar coordinates with Lightness, Chroma and Hue (CIELUV) which are just as mentioned a different mathematical description of the vectors in this 3 dimensional space.
For example the figure below where the L axis is pointing from lower left with white (non visible) to the viewer in black
while you can see the colors in the plane with these 4 primary elements (blue and yellow, green and red).
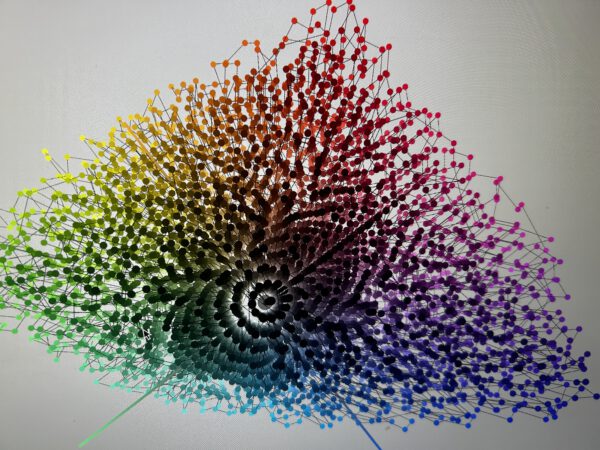
the 3D model can be viewed in this page here.
A few words to the graphics. The lines between the dots is a chain from one color dot to the next available nearest neighbor and so in the end this is the full chain of all colors starting from black to the end with all its different flavours.
I need to add a few more structural elements to this model, like real nearest neighbors.
I should extend this to a proper class.. with all the function we wanna have to use this in our color art.